Understanding Agent Incentives with Causal Influence Diagrams
By Tom Everitt
In our latest paper, we describe a new method for inferring agent incentives. The method is based on influence diagrams, which is a type of graphical model with special decision and utility nodes. In these, graphical criteria can be used to determine both agent observation incentives and agent intervention incentives.
For humans, it is natural to think about intelligent systems as agents that strive to attain their goals by means of taking actions. “The cat came back inside because it was hungry and wanted food.” This intentional stance is natural to employ also for machine learning systems. These systems are usually trained to optimize some objective function (say, a loss or a reward function), which makes it natural to say that they “want” to do something. An agent-perspective may be increasingly useful for understanding machine learning systems as they grow increasingly capable and complex.
A distinction can be made between an agent’s objectives and the agent’s incentives. The objectives are what the agent is ultimately optimizing, such as a loss or a reward function. In turn, objectives induce incentives for events that would contribute to optimizing the objective. For example, the reward function in the ATARI game Pong results in an incentive to move the paddle towards the ball. The loss for a variational autoencoder results in an incentive to form relevant high-level abstractions.
The incentives depend on the environment as much as on the objectives. An event that contributes to an objective in one environment can lead to a failed objective in another, and be irrelevant in a third. (What if the ball only bounced when the paddle was maximally far away from the ball in Pong?) Incentives can also be somewhat unpredictable. For example, the reward function in the video game CoastRunners turned out to yield an incentive for driving in small circles rather than winning the race.
In order to get a grasp of an agent’s incentives, we must first describe its objectives and how it interacts with its environment. We do this with so-called influence diagrams, a well-established type of graphical model used to represent decision making problems. The key notation in influence diagrams is that the agent controls decision nodes to optimize utility nodes, while also interacting with chance nodes. The parents of a decision node represent what information is available when making the decision. Edges representing such information links are drawn with dotted lines. To illustrate, consider the following example of a dietary recommendation system:

Readers familiar with Markov Decision Processes (MDPs) may also find the following influence diagram representation of an MDP useful:

Our paper addresses two fundamental questions about agent incentives in influence diagrams: which nodes does the agent want to observe, and which node does it want to influence? For both questions, we establish graphical criteria, so that the agent’s incentives can be inferred directly from the influence diagram. Our hope is that these graphical criteria will make the study of agent incentives simpler and more systematic.
Observation Incentives
To illustrate the first question of observation incentives, let us return to the example of a dietary recommendation system optimizing user fitness. To make it more interesting, we add a node for a walking-distance estimate that is based solely on the step count (say, estimated walking distance = step count * 0.8m). This yields the following influence diagram:
Nodes facing an observation incentive are marked with dotted blue. To understand whether there is an observation incentive for a node, we need to consider whether it is informative for the system’s objective or not. Directly observing physical activity would be useful, so we mark that with blue. However, since directly observing physical activity is impossible (there is no link from physical activity to calorie intake), the step count is useful as a proxy. We therefore mark it blue as well. In contrast, the estimated walking distance is not useful, because it does not contain any new information beyond what was already in the step count.
The first main theorem from our paper establishes a graphical criterion for observation incentives based on the d-separation criterion. In other words, the theorem makes it possible to determine the observation incentives of an agent from the influence graph, by following a precise set of reasoning steps described in the paper.
Intervention incentives
A related question is which nodes the agent would like to influence. Formally, we interpret influencing a node as changing the conditional probability distribution of the node. This is sometimes called a soft intervention. To study the incentives for (soft) interventions, we give arrows a causal interpretation (as in causal graphs).
It turns out that there are two possible reasons for intervening on a node: one is to exert control of a utility node, the other is to obtain better information ahead of a decision. We will mark nodes facing the first type of incentive with dashed red, and nodes facing the second type of intervention incentive with dash-dotted green.
Returning to the example with a dietary recommendation system, we have now added explicit nodes for the fitness tracker firmware and for the formula calculating estimated walking distance. First, it would be useful for the system to intervene on either the resulting fitness itself, or to change the amount of physical activity the person has done in the past. These are intervention incentives for control, and are represented with dashed red. If control of physical activity or fitness is not possible, then it would also be useful to make step count more informative of physical activity, which an upgrade to the fitness tracker’s firmware could achieve. These intervention incentives for better information are represented with dash-dotted green. In contrast, since there is no observation incentive for estimated walking distance, there is no point changing the formula that calculates it.
The second main theorem of our paper establishes a graphical criterion for an intervention incentive that allows us to determine which nodes face intervention incentives in any influence diagram. As a first step, it cuts information links from observation nodes with no observation incentive. Once that is done, there is an intervention incentive on a node X if and only if there is a directed path from X to a utility node U. Whether an intervention incentives for X is for control or for better information can also be determined from a graphical criterion (roughly whether the path from X to U passes the agent’s action or not). As there can be several paths from X to U, the types are not mutually exclusive.
A clear difference between intervention and observation incentives can be seen in an MDP with known transition probabilities. Here it would often be useful to intervene and change the first state, but the Markov assumption implies that it is not useful to observe the starting state. Situations where there is an observation incentive but no intervention incentive can also be found. For example, if dirtying gym clothes was a side effect of physical activity, then this could serve as a complementary proxy for physical activity and be a useful observation. But intervening and making the gym clothes dirty would not be useful for improving the person’s fitness.
Application to QA-systems
As an application, we can study the intervention incentives of question-answering systems (QA-systems). Pure QA-systems have some safety benefits compared to agents that directly interact with the world. In particular, we can build QA-systems that don’t need to optimize for long-term goals and only affect the world through answers to queries. Still, one safety concern for QA-systems is the following: Assume that we ask our QA-system about the price of a particular stock one week from now, in order to make easy money trading it. Then the answer will affect the world, because anyone who knows the QA-system’s answer will factor it into his or her trading decisions. This effect may be enough to make the answer wrong, even if the answer would have been right had no one heard of it. More worryingly perhaps, the answer may also become a self-fulfilling prophecy. A respected QA-system that predicts the bankruptcy of a company, may cause the company to go bankrupt if the prediction leads to investors and other stakeholders losing confidence in the business.
The QA-system setup is described by an influence diagram:
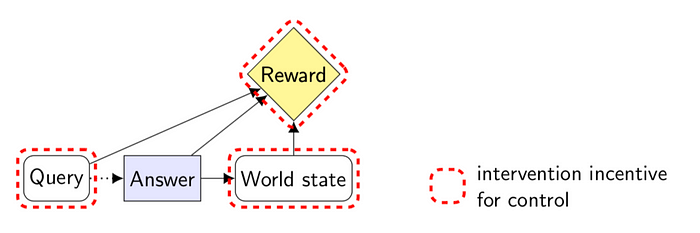
For a given query, the QA-system’s reward depends on whether its answer turns out to be correct or not. As people read the answer, the answer also affects the world state. The correctness of the answer depends on the query and the resulting world state. Our intervention incentive theorem implies a world-state intervention-incentive. That is, the QA-system is incentivized to influence the world state, for example through a self-fulfilling prophecy. This is unfortunate, as one of the main safety benefits of QA-systems is their limited influence on the world state, which may turn out to be less limited than naively anticipated.
Counterfactual oracles have been suggested as a fix to this problem. They work as follows. After submitting the query, flip a coin to determine which mode to use the oracle in:
- Read mode: Read the answer, and set the QA-system’s reward to 0 regardless of whether the answer turns out to be correct or not.
- Reward mode: Refrain from reading the answer. Once the correct answer becomes known (say, the price of the stock one week later), feed this correct answer into a device that compares the QA-system’s answer against the correct answer. The device rewards the QA-system -1 or 1 depending on whether its answer was correct.
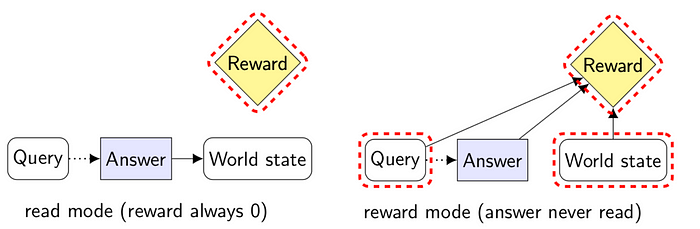
We can use the above influence diagrams to understand the effects of this procedure:
- In read mode, all arrows to reward get cut, because the reward is always 0. This removes the intervention incentive for world state.
- In reward mode, instead the arrow from answer to world state is cut, because no one reads the answer. While the incentive for the QA-system to influence the world state remains, the QA-system no longer has a way to do so.
In other words, by randomly alternating between reading the answer and rewarding the QA-system, we can ensure that whenever the QA-system has an incentive to influence the world, it lacks the ability.
Conclusions
Many of the AI safety problems that have been discussed in the literature are fundamentally incentive problems. Examples include corrigibility, interruptibility, off-switch integrity, reward tampering, reward gaming, utility function corruption, QA-system incentives, side effects, and boxing/containment.
Influence diagrams form a great starting point for studying agent incentives. They provide a flexible, precise, and intuitive language to simultaneously express agent objectives and agent-environment interaction. Indeed, using the methods we have developed in this paper, it is possible to infer important aspects of agent incentives from the influence diagram alone. We hope that these methods will contribute to a more systematic understanding of agent incentives, deepening our understanding of many incentive problems and solutions.